Tools – Comprehend
All the tools listed below can be used by a team and their leader to explore the meaning, nature, or importance of some idea(s), problem(s), or topic(s) that the group needs to expand upon. Utilizing one and/or many of the Comprehend Tools will help teams to derive a common understanding of what is being discussed or asked of them through the use of strategies such as clarification, documentation, framing, or organization. These tools are also helpful in getting everyone on the team trying to accomplish the same goal and eliminate inconsistencies.
Procedures
Purpose
The goal!
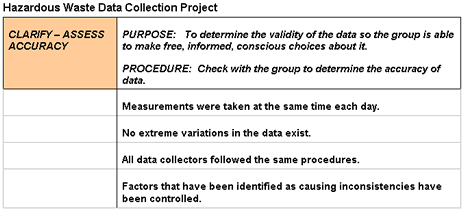
To determine the validity of the data so the team is able to make free, informed, conscious choices about it.
What to do:
Check with the team to determine the accuracy of the data.
When to use:
If data was collected by a number of individuals or over a long duration, it is imperative to ensure that data was collected the same way everytime to avoid inconsistencies and variations. Clarifying accuracy by evaluating individuals’ data collecting procedures, is the first step towards this goal.
Responsibility
Team Facilitator
Procedure
Step
Action
1
From the FrameTEC menu bar, select Comprehend Ideas, Clarify – Assess Accuracy.
2
In the cell above the table to the left labeled “Click here and type topic,” type the topic.
3
Ask team members to communicate their feelings concerning the accuracy of the data that has been collected, that will help make the desired decision.
Important: They should be able to give reasons and understandings as to why they think the data is valid.
4
In the cell labeled “Click here and type understanding,” type the discussion statements.
5
Repeat Steps 3 & 4 until the subject has been exhausted.
Help:
· To add more rows beyond the original four that are provided in the table, press TAB, or if you need to create a blank row, put the cursor at the end of a row outside the table and press ENTER.
· If you would like to move to a new frame, be sure to click outside of the bottom of the table and press RETURN first; then insert the next tool frame that is desired from the drop down FrameTEC list.
Example
Tools
FrameTEC-MS Word
Purpose
The goal!
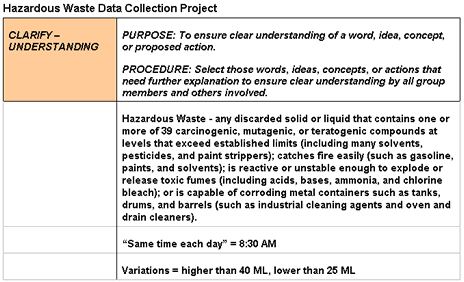
To ensure clear understanding of a word, idea, concept, or proposed action.
What to do:
Select those words, ideas, concepts, or actions that need further explanation to ensure clear understanding by all team members and others involved.
When to use:
If the team doesn’t completely have a mutual take on what the word, idea, concept, or proposed action is being discussed, taking time to ensure coherency helps your team arrive at a common understanding – it is important to get everyone on the team trying to accomplish the same goal and eliminate inconsistencies.
Responsibility
Team Facilitator
Procedure
Step
Action
1
From the FrameTEC menu bar, select Comprehend Ideas, Clarify – Understanding.
2
In the cell above the table to the left labeled “Click here and type topic,” type the word, idea, concept, or proposed action to be discussed.
3
In the cells labeled “Click here and type understanding,” type what the team claims to understand concerning the topic.
4
Repeat step 3 until the subject has been exhausted.
Help:
· If you would like to add more rows beyond the original four that are provided in the table, press TAB.
· If you would like to add another tool to the same document, click outside of the bottom of the table and press ENTER; then from the drop down FrameTEC list, select the desired tool.
Example
Tools
FrameTEC-MS Word
Purpose
The goal!
To ensure that all team members have a common understanding of a word, idea, concept, or action to enhance communication and minimize confusion.
What to do:
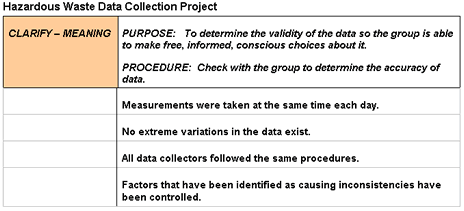
Ask someone to give a statement, as they understand it, and then check with the rest of the team to see if they understand it to mean the same or something different. For a broad or complex idea, break it down and clarify each part of the statement.
When to use:
If the team seems confused or previous conversations have indicated a number of different takes on the subject/topic, using this tool will help facilitate the process for clarifying.
Responsibility
Team Facilitator
Procedure
Step
Action
1
From the FrameTEC menu bar, select Comprehend Ideas, Clarify – Meaning.
2
In the cell above the table to the left labeled “Click here and type topic,” type the word, idea, concept, or proposed action to be discussed.
3
Ask someone to give a statement about the topic, as they understand it, and type it In the cell labeled “Click here and type understanding.”
4
Check with the rest of the team to see if they understand it to mean the same or something different and type these discussion statements in the cell labeled “Click here and type meaning.”
5
Repeat Steps 3 & 4 until the topic’s meaning is agreed upon by the group.
Help:
· To add more rows beyond the original four that are provided in the table, press TAB, or if you need to create a blank row, put the cursor at the end of a row outside the table and press ENTER.
· If you would like to move to a new frame, be sure to click outside of the bottom of the table and press RETURN first; then insert the next tool frame that is desired from the drop down FrameTEC list.
Example
Tools
FrameTEC-MS Word
Purpose
The goal!
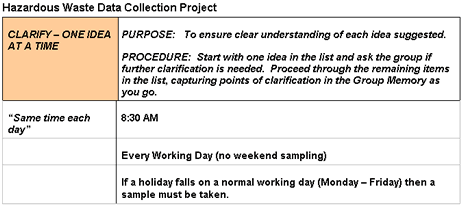
To ensure clear understanding of each idea suggested.
What to do:
Start with one idea in the list and ask the team if further clarification is needed. Proceed through the remaining items in the list, capturing points of clarification in the Team Memory as you go.
When to use:
After a team has brainstormed a list of ideas, it may be necessary to obtain further clarification from the team concerning some of the ideas. This tool helps work through the process.
Responsibility
Team Facilitator
Procedure
Step
Action
1
From the FrameTEC menu bar, select Comprehend Ideas, Clarify – One Idea at a time.
2
In the top left corner above the table in the cell labeled “Click here and type topic,” type the subject that the list of ideas is focused around.
3
In the left column labeled “Click here and type idea,” type the first idea from the list that needs clarification.
4
Ask the team to clarify the concept and type these statements in the cells labeled “Click here and type clarification.”
Important: If needed, the Team Facilitator can provide help when the team is having problems clarifying the idea.
5
Repeat Steps 3 & 4 until every idea from the list is thoroughly clarified and agreed upon by the team.
Help:
· To add more rows beyond the original four that are provided in the table, press TAB, or if you need to create a blank row, put the cursor at the end of a row outside the table and press ENTER.
· If you would like to move to a new frame, be sure to click outside of the bottom of the table and press RETURN first; then insert the next tool frame that is desired from the drop down FrameTEC list.
Example
Tools
FrameTEC-MS Word
Purpose
The goal!
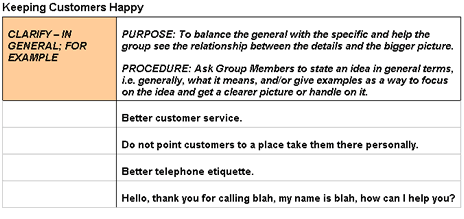
To balance the general with the specific and help the team see the relationship between the details and the bigger picture.
What to do:
Ask team members to state an idea in general terms, (i.e. generally, what it means), and / or give examples as a way to focus on the idea and get a clearer picture or handle on it.
When to use:
After a team has brainstormed, it may be necessary to generalize it or get the team to give examples so they are able to focus more clearly on the idea.
Responsibility
Team Facilitator
Procedure
Step
Action
1
From the FrameTEC menu bar, select Comprehend Ideas, Clarify – In General; For Example.
2
In the top left corner above the table in the cell labeled “Click here and type topic,” type the subject that the list of ideas is focused around.
3
In the left column labeled “Click here and type idea,” type the first idea stated from the team.
4
In the cells labeled “Click here and type general statement” and “Click here and type example,” ask the team to generalize or provide examples about the idea.
5
Repeat step 4 until the team has a clear picture of the idea being discussed.
Help:
· If you would like to add more rows beyond the original four that are provided in the table, press TAB.
· If you would like to add another tool to the same document, click outside of the bottom of the table and press ENTER; then from the drop down FrameTEC list, select the desired tool.
Example
Tools
FrameTEC-MS Word
Purpose
The goal!
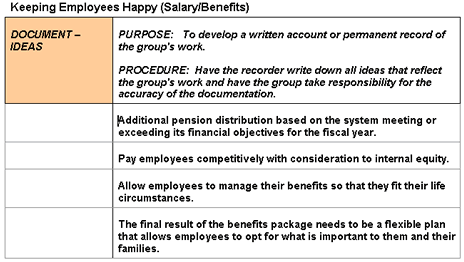
To develop a written account or permanent record of the teams’ work.
What to do:
Have the recorder write down all ideas that reflect the teams’ work and have the team take responsibility for the accuracy of the documentation.
When to use:
Whenever the team is together discussing the topic; all ideas should be documented from the time the team begins work because:
Good records help new members catch up and keep old members informed of developments.
The team may have to retrace its steps to track down problems or errors. Good records make this easier.
Having up-to-date records makes it easier to prepare presentations.
Responsibility
Team Facilitator
Procedure
Step
Action
1
From the FrameTEC menu bar, select Comprehend Ideas, Document – Ideas.
2
In the top left corner above the table in the cell labeled “Click here and type topic,” type the subject that the list of ideas is focused around.
3
In the cells labeled “Click here and type idea,” type all the ideas that reflect the teams’ work.
Help:
· To add more rows beyond the original four that are provided in the table, press TAB, or if you need to create a blank row, put the cursor at the end of a row outside the table and press ENTER.
· If you would like to move to a new frame, be sure to click outside of the bottom of the table and press RETURN first; then insert the next tool frame that is desired from the drop down FrameTEC list.
Example
Tools
FrameTEC-MS Word
Purpose
The goal!
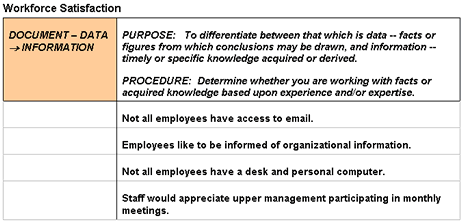
To differentiate between that which is data — facts or figures from which conclusions may be drawn, and information — timely or specific knowledge acquired or derived.
What to do:
Determine whether you are working with facts or acquired knowledge based upon experience and / or expertise.
When to use:
If the team needs to make a decision, it is necessary to take the brainstormed ideas and determine which are data and which are information so they can choose the best possible solution.
Responsibility
Team Facilitator
Procedure
Step
Action
1
From the FrameTEC menu bar, select Comprehend Ideas, Document – Data –> Information.
2
In the top left corner above the table in the cell labeled “Click here and type topic,” type the subject that the data / information is focused around.
3
In the cells labeled “Click here and type data,” type the facts or figures from which conclusions can be drawn.
4
In the cells labeled “Click here and type information,” type knowledge statements that have been acquired or derived, not necessarily proven.
Help:
· To add more rows beyond the original four that are provided in the table, press TAB, or if you need to create a blank row, put the cursor at the end of a row outside the table and press ENTER.
· If you would like to move to a new frame, be sure to click outside of the bottom of the table and press RETURN first; then insert the next tool frame that is desired from the drop down FrameTEC list.
Example
Tools
FrameTEC-MS Word
Purpose
The goal!
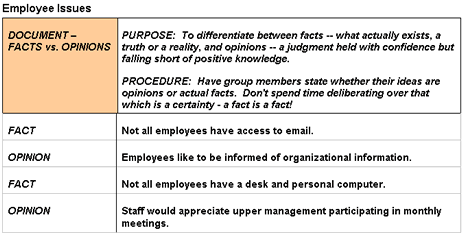
To differentiate between facts — what actually exists, a truth or a reality, and opinions — a judgment held with confidence but falling short of positive knowledge.
What to do:
Have team members state whether their ideas are opinions or actual facts. Don’t spend time deliberating over that which is a certainty – a fact is a fact!
When to use:
If the team needs to make a decision based on brainstormed ideas, it is necessary to determine which are facts and which are opinions so they can choose the best possible solution.
Responsibility
Team Facilitator
Procedure
Step
Action
1
From the FrameTEC menu bar, select Comprehend Ideas, Document – Facts vs. Opinions.
2
In the top left corner above the table in the cell labeled “Click here and type topic,” type the subject that the team will be discussing.
3
In the right hand cell labeled “Click here and type statement,” type any thoughts shared by the team members.
4
In the left hand cell labeled “Click here and type ‘Fact or Opinion’,” type FACT or OPINION once the person has identified their statement as being fact or opinion.
5
Repeat steps 3 & 4 until all members have shared their statements concerning the topic and have identified them as either fact or opinion.
Help:
· To add more rows beyond the original four that are provided in the table, press TAB, or if you need to create a blank row, put the cursor at the end of a row outside the table and press ENTER.
· If you would like to move to a new frame, be sure to click outside of the bottom of the table and press RETURN first; then insert the next tool frame that is desired from the drop down FrameTEC list.
Example
Tools
FrameTEC_MS Word
Purpose
The goal!
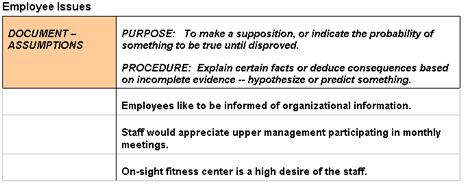
To make a supposition, or indicate the probability of something to be true until disproved.
What to do:
Explain certain facts or deduce consequences based on incomplete evidence — hypothesize or predict something.
When to use:
If all information is not available, but the group must make a decision.
Responsibility
Team Facilitator
Procedure
Step
Action
1
From the FrameTEC menu bar, select Comprehend Ideas, Document – Assumptions.
2
In the top left corner above the table in the cell labeled “Click here and type topic,” type the subject that the team will be discussing.
3
In the cells labeled “Click here and type information,” type all information concerning the topic, regardless if they are just hypothesis or predictions.
Help:
· To add more rows beyond the original four that are provided in the table, press TAB, or if you need to create a blank row, put the cursor at the end of a row outside the table and press ENTER.
· If you would like to move to a new frame, be sure to click outside of the bottom of the table and press RETURN first; then insert the next tool frame that is desired from the drop down FrameTEC list.
Example
Tools
FrameTEC-MS Word
Purpose
The goal!
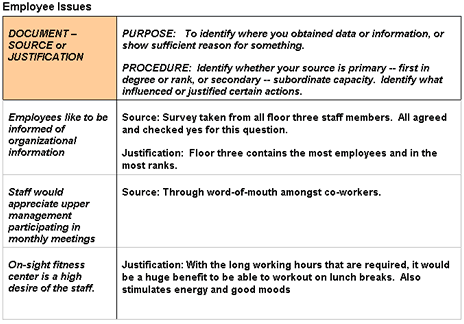
To identify where you obtained data or information, or show sufficient reason for something.
What to do:
Identify whether your source is primary — first in degree or rank, or secondary — subordinate capacity; identify what influenced or justified certain actions.
When to use:
If data that has been collected needs clarification or re-collection or perhaps an action needs justification, this tool helps determine where the data was obtained or can assist in showing sufficient reason for the action taken.
Responsibility
Team Facilitator
Procedure
Step
Action
1
From the FrameTEC menu bar, select Comprehend Ideas, Document – Source or Justification.
2
In the top left corner above the table in the cell labeled “Click here and type topic,” type the subject that the group will be discussing.
3
In the left cell labeled “Click here and type idea,” type the idea or data that is being discussed.
4
In the right cell labeled “Click here and type primary source,” type the determined source of the idea/data and ranking of the data.
5
In the cell labeled “Click here and type justification,” type the findings from the research and discussions about the data or actions needing justification.
6
Repeat steps 3 – 5 until all sources of data have been identified or justification has been determined by the team.
Help:
· To add more rows beyond the original four that are provided in the table, press TAB, or if you need to create a blank row, put the cursor at the end of a row outside the table and press ENTER.
· If you would like to move to a new frame, be sure to click outside of the bottom of the table and press RETURN first; then insert the next tool frame that is desired from the drop down FrameTEC list.
Example
Tools
FrameTEC-MS Word
Purpose
The goal!
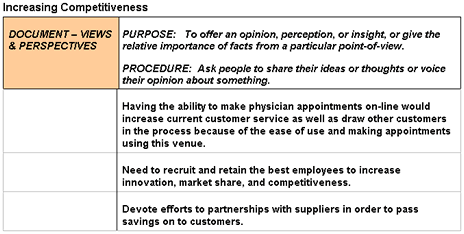
To offer an opinion, perception, or insight, or give the relative importance of facts from a particular point-of-view.
What to do:
Ask people to share their ideas or thoughts or voice their opinion about something.
When to use:
Use to gather view points and perspectives of each individual team member.
Responsibility
Team Facilitator
Procedure
Step
Action
1
From the FrameTEC menu bar, select Comprehend Ideas, Document – Views & Perspectives.
2
In the top left corner above the table in the cell labeled “Click here and type topic,” type the subject that the team will be discussing.
3
In the cell labeled “Click here and type view,” type the teams’ ideas or thoughts relative to a particular point-of-view.
4
In the cell labeled “Click here and type perspective,” type the opinions, insights, or relative importance of facts to the discussion.
5
Repeat steps 3 & 4 until all points-of-view have been discussed on the topic.
Help:
· To add more rows beyond the original four that are provided the table, press TAB, or if you need to create a blank row, put the cursor at the end of a row outside the table and press ENTER.
· If you would like to move to a new frame, be sure to click outside of the bottom of the table and press RETURN first; then insert the next tool frame that is desired from the drop down FrameTEC list.
Example
Tools
FrameTEC-MS Word
Purpose
The goal!
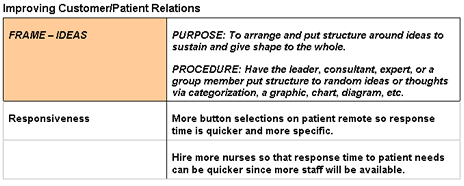
To arrange and put structure around ideas to sustain and give shape to the whole.
What to do:
Have the leader, consultant, expert, or a team member put structure to random ideas or thoughts via categorization, a graphic, chart, diagram, etc.
When to use:
If the team is brainstorming random ideas, all of which are of different topics and such, this tool will help bring structure to the activity.
Responsibility
Team Facilitator
Procedure
Step
Action
1
From the FrameTEC menu bar, select Comprehend Ideas, Frame – Ideas.
2
In the top left corner above the table in the cell labeled “Click here and type topic,” type the subject that the team will be discussing.
3
In the right hand cell labeled “Click here and type ideas,” type the teams’ ideas or thoughts that need some structure given by the leader.
4
In the left cell labeled “Click here and type category,” have the consultant or expert type the category (or use a graphic, chart, or diagram) of the random thoughts or ideas introduced by the team.
5
Repeat steps 3 & 4 until all the ideas have been framed in an organized, meaningful manner.
Help:
· To add more rows beyond the original four that are provided in the table, press TAB, or if you need to create a blank row, put the cursor at the end of a row outside the table and press ENTER.
· If you would like to move to a new frame, be sure to click outside of the bottom of the table and press RETURN first; then insert the next tool frame that is desired from the drop down FrameTEC list.
Example
Tools
FrameTEC-MS Word
Purpose
The goal!
To determine the amount, capacity, or extent of something based upon reasonable degree, limitation, or standard of comparison.
What to do:
Ask the team to identify an acceptable or optimum standard. Next compare, judge, or weigh the results and success against that benchmark.
When to use:
If the team is required to measure something’s quantity, capacity, or extent.
Responsibility
Team Facilitator
Procedure
Step
Action
1
From theFrameTEC menu bar, select Comprehend Ideas, Frame – Measure.
2
In the top left corner above the table in the cell labeled “Click here and type topic,” type the subject that the group will be discussing.
3
4
5
Repeat steps 3 & 4.
Help:
· To add more rows beyond the original four that are provided in the table, press TAB, or if you need to create a blank row, put the cursor at the end of a row outside the table and press ENTER.
· If you would like to move to a new frame, be sure to click outside of the bottom of the table and press RETURN first; then insert the next tool frame that is desired from the drop down FrameTEC list.
Purpose
The goal!
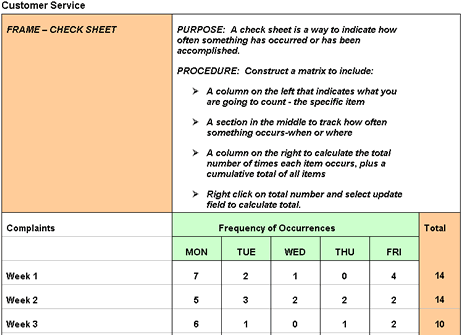
A check sheet is a way to indicate how often something has occurred or has been accomplished.
What to do:
Construct a matrix to include:
A column on the left that indicates what you are going to count – the specific item.
A section in the middle to track how often something occurs: when or where.
A column on the right to calculate the total number of times each item occurs, plus a cumulative total of all items.
When to use:
When you need to gather data based on sample observations in order to detect patterns.
Responsibility
Team Facilitator
Procedure
Step
Action
1
From the FrameTEC menu bar, select Comprehend Ideas, Frame – Check Sheet.
2
In the top left corner above the table in the cell labeled “Click here and type topic,” type the subject that the group will be discussing.
3
In the left hand cell labeled “Click here and type what to count,” type the item to be counted.
Example: Complaints, returns, fries ordered, etc.
4
In the foremost left hand cell labeled “Click here and type week to count,” type the week that is to be counted or dates of first counting time frame.
5
Under the corresponding column, type the number of times the item occurs for each day.
Note: Continue until a full week has been recorded.
6
Once finished with data collecting for the first time frame, right click on total number and select update field to calculate total.
7
Repeat steps 4 – 6 for each row containing a week that needs to be calculated.
8
Right click on the Cumulative Results number at the bottom of the table, select update field to calculate vertical totals.
Help:
· To add more rows beyond the original four that are provided in the table, press TAB, or if you need to create a blank row, put the cursor at the end of a row outside the table and press ENTER.
· If you would like to move to a new frame, be sure to click outside of the bottom of the table and press RETURN first; then insert the next tool frame that is desired from the drop down FrameTEC list.
Example
Tools
FrameTEC-MS Word
Purpose
The goal!
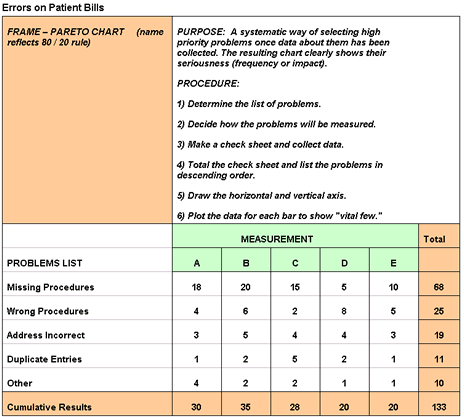
A systematic way of selecting high priority problems once data about them has been collected. The resulting chart clearly shows their seriousness (frequency or impact).
What to do:
1) Determine the list of problems.
2) Decide how the problems will be measured.
3) Complete the check sheet in the pareto chart frame.
4) Total the check sheet and list the problems in descending order.
5) Draw the horizontal and vertical axis.
6) Plot the data for each bar to show “vital few.”
When to use:
Pareto charts are useful throughout problem solving:
early on to identify exactly which problem(s) should be studied,
later to narrow down which causes of the problem to address first.
If you need to determine the frequency or impact of your problems, a pareto chart will reflect such information.
Responsibility
Team Facilitator
Procedure
Step
Action
1
From the FrameTEC menu bar, select Comprehend Ideas, Frame – Pareto Chart.
2
In the top left corner above the table in the cell labeled “Click here and type topic,” type the subject that the group will be discussing.
3
In the left hand cells labeled “Click here and type problems,” type the problems to be counted.
4
Under the corresponding column, type the number of times the item occurs for each problem.
5
When finished with data collecting for each problem, right click on the number in the Total column and select Update field to calculate totals for each of the rows.
6
Right click on the Cumulative Results number in the last rows of the table, select Update field to calculate totals for each of the columns.
7
List the problems in descending order according to their right hand totals.
8
Draw a horizontal and vertical axis.
9
Plot the data in the Total column for each row.
10
Format the graph accordingly.
Help:
· If you would like to add more rows beyond the original four that are provided in the table, press TAB.
· If you would like to add another tool to the same document, click outside of the bottom of the table and press ENTER; then from the drop down FrameTEC list, select the desired tool.
Example
Tools
FrameTEC-MS Word
Purpose
The goal!
To move from the verbal to the visual, and use graphics to display data or information.
What to do:
Ask someone from the team to draw a picture of what they are saying so that people can see it as well as hear it. Have the Recorder electronically duplicate it in the Team Memory.
When to use:
If the team is having a hard time visualizing a member’s idea use a diagram to better illustrate the suggestion.
Responsibility
Team Facilitator
Procedure
Step
Action
1
From the FrameTEC menu bar, select Comprehend Ideas, Frame – Diagram.
2
In the top left corner above the table in the cell labeled “Click here and type topic,” type the subject that the team will be discussing.
3
Help:
· To add more rows beyond the original four that are provided in the table, press TAB, or if you need to create a blank row, put the cursor at the end of a row outside the table and press ENTER.
· If you would like to move to a new frame, be sure to click outside of the bottom of the table and press RETURN first; then insert the next tool frame that is desired from the drop down FrameTEC list.
Purpose
The goal!
To plan a schedule for the completion of any task along with it’s related sub-tasks.
What to do:
Determine the order and duration of jobs that need to be completed in order to fulfill the desired outcome of the project endeavor.
When to use:
Use when the task is familiar to the team and the duration of the sub-tasks are also identifiable. Also helpful when simultaneous implementation paths must be coordinated.
Definition:
The Arrow Diagram is another name for a combination of the Program Evaluation and Review Technique (PERT) and the Critical Path Method (CPM). It is a method of drawing the PERT / CPM relationships among activities in any project.
Responsibility
Team Facilitator
Procedure
Step
Action
1
From the FrameTEC menu bar, select Comprehend Ideas, Frame – Arrow Diagram / PERT / CPM.
2
Have the team list all of the necessary tasks to complete the project.
3
Sequence all the identified tasks.
4
Give a time duration for each job.
5
Create the project’s Arrow Diagram using the information gathered.
6
Using the Critical Path Method (the longest cumulative duration of any path), calculate the shortest possible implementation schedule.
7
Review and revise the diagram.
Help:
· To add more rows beyond the original four that are provided in the table, press TAB, or if you need to create a blank row, put the cursor at the end of a row outside the table and press ENTER.
· If you would like to move to a new frame, be sure to click outside of the bottom of the table and press RETURN first; then insert the next tool frame that is desired from the drop down FrameTEC list.
Purpose
The goal!
To show the amount of variation over time in terms of critical measurements (typically used to analyze a process). This takes measurement data and displays whether it falls within or outside specifications (variability), vs. whether it is “skewed”, and outside of the expected normal.
What to do:
For each measure, count total data points (#). Determine the range (R)– lowest to highest. Divide data into class (C; # easy to view). Determine width (W) of each class; W = R / C. Add widths to lowest for class boundaries. Complete check sheet for each class. Draw the horizontal and vertical axis. Plot the data bar for each class.
When to use:
If all data points need to be displayed in order to get a quick look at the range of measurements, roughly where the center of the data is, and how data points are distributed around the average. They are especially helpful if used to get a quick look at data before further analysis.
Responsibility
Team Facilitator
Procedure
Step
Action
1
From the FrameTEC menu bar, select Comprehend Ideas, Frame – Histogram.
2
In the top left corner above the table in the cell labeled “Click here and type topic,” type the subject that the team will be discussing.
3
Gather the data points.
4
Count the number of data points in the set data.
5
Determine the range, R, for the entire data set.
Important: R = the smallest value in the set of data – the largest value
6
Divide the range value into a certain number of classes, C.
7
Determine the number of classes by how many would be visually easy to view.
Example: For 125 data points in a set, C could equal anywhere from 7 – 12 classes.
8
Determine the class width, W.
Important: W = R / C
9
Determine the class boundary, or end points, by taking the smallest individual measurement in the data set (this is the lower end point of the first class boundary) and take this number and add the class width to it (this is the high end point of the first class boundary and the low end point of the second class boundary).
10
Repeat step 9 until all classes have a boundary set and contain the range of all the data points in the data set.
11
Construct a check-sheet based on the values computed above.
12
Construct the Histogram by plotting the data bar for each class represented in the check-sheet.
Help:
· If you would like to add more rows beyond the original four that are provided in the table, press TAB.
· If you would like to add another tool to the same document, click outside of the bottom of the table and press ENTER; then from the drop down FrameTEC list, select the desired tool.
Purpose
The goal!
To show the relationship between two variables or characteristics. This displays the strength of relatedness (cluster in a straight line indicates strongest). Strength suggests (but cannot prove) a causal relationship.
What to do:
Collect sets of paired data points. Plot the measurements. Use the diagram to study the possible relationship between the two variables. Note how the plotted points are clustered and determine if a strong or weak, positive or negative, or no relationship at all exists between the variables.
When to use:
When a relationship between two characteristics of data is needed. It can be used to check whether one variable is related to another variable, and is an effective way to communicate the relationship the data forms.
Example: negative, positive, or none.
Responsibility
Team Facilitator
Procedure
Step
Action
1
From the FrameTEC menu bar, select Comprehend Ideas, Frame – Scatter Plot.
2
In the top left corner above the table in the cell labeled “Click here and type topic,” type the subject that the team will be discussing.
3
Collect 50 to 100 paired samples of data that you think may be related and construct a data sheet.
4
Draw one variable on the horizontal axis (usually the possible “cause” variable) and the other variable on the vertical axis (usually the “effect” variable).
5
Plot the data on the diagram.
6
If values are repeated, circle those points as many times as appropriate.
7
Determine the relationship between the variables.
Help:
· If you would like to add more rows beyond the original four that are provided in the table, press TAB.
· If you would like to add another tool to the same document, click outside of the bottom of the table and press ENTER; then from the drop down FrameTEC list, select the desired tool.
Purpose
Also known as the FISHBONE DIAGRAM (Invented by Kaoru Ishikawa)
The goal!
To identify the factors or “causes” that led to a problem, result or specific “effect. ” The “fishbone” type branches show the causal relationships or planned actions for a result.
What to do:
Put a problem or desired result on the right. Draw a large arrow to this problem / result. Define categories and draw main branch lines / arrows to each of these. List on separate lines / arrows the factors, causes, or actions fitting into each category.
When to use:
To identify and organize the possible causes of a problem in a structured format.
Responsibility
Team Facilitator
Procedure
Step
Action
1
From the FrameTEC menu bar, select Comprehend Ideas, Frame – Cause and Effect.
2
In the top left corner above the table in the cell labeled “Click here and type topic,” type the problem / desired result that the team will be discussing.
3
Brainstorm a list of possible causes to the problem or possible implementation plans to attain the desired result.
4
Draw a box to the far right of a blank document, type the problem or desired result inside.
5
Draw a large arrow to this problem / result.
6
Define categories and draw main branch lines / arrows to each of these.
7
List on separate lines / arrows, fitting into each category, the
· Factors
· Causes
· Actions
Help:
· To add more rows beyond the original four that are provided in the table, press TAB, or if you need to create a blank row, put the cursor at the end of a row outside the table and press ENTER.
· If you would like to move to a new frame, be sure to click outside of the bottom of the table and press RETURN first; then insert the next tool frame that is desired from the drop down FrameTEC list.
Purpose
The goal!
To graphically determine the interrelationship between and among ideas.
What to do:
Take the central idea, issue, or problem, and map out the logical or sequential links among related items.
When to use:
Use when sequencing is important, root causes must be identified, topic and ideas are amply complex in nature, and there is adequate time to complete the process involved in doing an interrelationship digraph.
Responsibility
Team Facilitator
Procedure
Step
Action
1
From the FrameTEC menu bar, select Comprehend Ideas, Frame- Interrelationship Digraph.
2
Have the team agree upon an issue / problem statement.
Sources: Affinity diagram, Cause & Effect Diagram, Tree Diagram
3
Display the completed cards one by one.
4
Draw the relationship arrows by answering the question, “Does this card cause / influence any of the other cards displayed?”
5
Repeat until all cards have been considered.
6
Review and revise the first round.
7
Select key items in the finalized diagram such as those with the highest total # of arrows.
8
Draw the final diagram using double boxing to identify the key factors / base causes.
Help:
· If you would like to add more rows beyond the original four that are provided in the table, press TAB.
· If you would like to add another tool to the same document, click outside of the bottom of the table and press ENTER; then from the drop down FrameTEC list, select the desired tool.
Purpose
The goal!
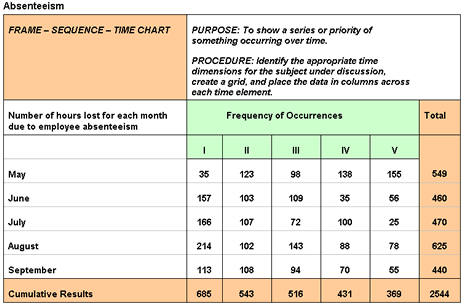
To show a series or priority of something occurring over time.
What to do:
Create a grid displaying collected data for determined time frames.
When to use:
When data needs to be documented and viewed over a specified period of time.
Responsibility
Team Facilitator
Procedure
Step
Action
1
From the FrameTEC menu bar, select Comprehend Ideas, Frame – Sequence-Time Chart.
2
In the top left corner above the table in the cell labeled “Click here and type topic,” type the subject that the team will be discussing.
3
In the cell labeled “Click here and type what to count,” type what the team will be measuring.
4
In the left-hand cells labeled “Click here and type week to count,” type the information of the appropriate time dimensions for the subject under discussion.
5
Place the data in columns across each time element.
6
Right click each number under the Total column and Cumulative Results row and select Update Field to calculate the values automatically.
Help:
· To add more rows beyond the original four that are provided in the table, press TAB, or if you need to create a blank row, put the cursor at the end of a row outside the table and press ENTER.
· If you would like to move to a new frame, be sure to click outside of the bottom of the table and press RETURN first; then insert the next tool frame that is desired from the drop down FrameTEC list.
Example
Tools
FrameTEC-MS Word
Purpose
The goal!
To represent the flow or sequence and movement of people, material, resources, or information. Displays the interconnectedness of steps in a process, including feedback and other loops. Compare the existing to the ideal for any gaps or loopholes that may cause potential trouble.
What to do:
Agree on level of detail, symbols, types of connectors, and process boundaries. Lay out steps in the existing process, noting breakdowns. Repeat for steps in ideal process. Identify gap or obstacles in moving to ideal.
When to use:
Flowcharts can be used to plan a project, describe a process, or to document a standard method of doing a job. They display a picture of a sequence of steps in a process. Flowcharts assist in understanding what is currently happening in a process, as well as helping to agree on the order of activities in a new, improved process.
Responsibility
Team Facilitator
Procedure
Step
Action
1
From the FrameTEC menu bar, select Comprehend Ideas, Frame – Flow Chart.
2
In the top left corner above the table in the cell labeled “Click here and type topic,” type the subject that the team will be discussing.
3
Help:
· To add more rows beyond the original four that are provided in the table, press TAB, or if you need to create a blank row, put the cursor at the end of a row outside the table and press ENTER.
· If you would like to move to a new frame, be sure to click outside of the bottom of the table and press RETURN first; then insert the next tool frame that is desired from the drop down FrameTEC list.
Purpose
The goal!
To create a systematic focal point for the team to begin mapping out the full range of paths and tasks that need to be accomplished in order to achieve a primary goal and every related subgoal.
What to do:
Choose the overall goal statement and systematically break down the methods by which it will be achieved.
When to use:
Use when detail is essential and implementation will be complex.
Responsibility
Team Facilitator
Procedure
Step
Action
1
From the FrameTEC menu bar, select Comprehend Ideas, Frame – Tree Diagram.
2
Choose the Tree Diagram goal statement.
Important: This could be the core cause, all or some of the header cards from the Affinity technique if completed, or from scratch obtained from open discussion.
3
Generate the major tree headings; the broadest implementation paths to pursue.
4
Place the goal statement and the major headings to the extreme left, right, or top of work surface.
5
Ask “What needs to happen / be addressed to resolve / achieve this problem / goal statement?” Fill in details at all levels.
6
Check logic and flow at each level of detail.
Help:
· To add more rows beyond the original four that are provided in the table, press TAB, or if you need to create a blank row, put the cursor at the end of a row outside the table and press ENTER.
· If you would like to move to a new frame, be sure to click outside of the bottom of the table and press RETURN first; then insert the next tool frame that is desired from the drop down FrameTEC list.
Tools
FrameTEC-MS Word
Purpose
The goal!
To map out all conceivable events and contingencies that could occur in a given implementation plan.
What to do:
Establish a clear goal and determine all possible solutions, being sure to take into account all contingencies along with appropriate countermeasures.
When to use:
Use when the team needs to analyze all realms of a new, complex implementation plan and the efficiency of the implementation is critical.
Responsibility
Team Facilitator
Procedure
Step
Action
1
From the FrameTEC menu bar, select Comprehend Ideas, Frame – PDPC.
2
Have the team decide what the goal is.
3
Begin discussing all possible options that can provide a solution for the goal.
4
For each solution, get the team to produce a set of implementation steps.
Important: Be sure to analyze “What if” problems and possible countermeasures.
5
Choose the implementation path that contains the least amount of “What ifs”.
Help:
· To add more rows beyond the original four that are provided in the table, press TAB, or if you need to create a blank row, put the cursor at the end of a row outside the table and press ENTER.
· If you would like to move to a new frame, be sure to click outside of the bottom of the table and press RETURN first; then insert the next tool frame that is desired from the drop down FrameTEC list.
Tools
FrameTEC-MS Word
Purpose
The goal!
To visually represent data so that a process can be monitored to determine whether or not the long range average is changing.
What to do:
Decide on measure to plot– vertical axis. Plot the data points (DPs) as they occur over a specified unit of time (T). Determine the average (A), A = sum (DPs) / T. Draw average line across chart. Note truly vital changes in process measure.
When to use:
When a simple display of trends within observation points over a specified time period is desired. Run charts should be used to capture and preserve good changes. They help identify whether the variation in a process is due to common causes or special causes which in turn, helps choose effective ways of reducing the variation.
Responsibility
Team Facilitator
Procedure
Step
Action
1
From the FrameTEC menu bar, select Comprehend Ideas, Frame – Flow Chart.
2
Draw the y and x axis.
3
Label the y-axis (vertical side of the graph) with the measurement aspect of the data the team will be collecting.
4
Label the x-axis (horizontal side of the graph) with the time period that will be covered.
5
Mark a point for each measurement or quantity observed or sampled for each point in time.
Important: Collected data must be kept in the order that it was gathered. Since it is tracking a characteristic over time, the sequence of data points is critical.
6
Connect the data points for easy use and interpretation.
7
Determine the average.
Important: A = sum of data points / specified unit of time.
8
Draw average line across chart.
9
Analyze the chart for extreme variations in the data.
Help:
· To add more rows beyond the original four that are provided in the table, press TAB, or if you need to create a blank row, put the cursor at the end of a row outside the table and press ENTER.
· If you would like to move to a new frame, be sure to click outside of the bottom of the table and press RETURN first; then insert the next tool frame that is desired from the drop down FrameTEC list.
Tools
FrameTEC-MS Word
Purpose
The goal!
A run chart indicates the range of variability (statistical control) built into a process. This distinguishes a “common cause” or inherent variation from a “special cause” that reflects unexpected or unpredictable variation.
What to do:
Complete a runchart adding statistically determined upper (Upper Control Limit (UCL))and possible lower (Lower Control Limit (LCL)) lines drawn on either side of the process average. If any of the plotted points fall outside of the limits or form unlikely patterns, the process is said to be “out of control.”
When to use:
Use when it is necessary to monitor a process to see whether it is in statistical control. A control chart is a time plot that also indicates the range of variation built into the system. Points that fall outside the limits or into particular patterns indicate the presence of a special cause of variation, a cause that deserves investigation.
Responsibility
Team Facilitator
Procedure
Step
Action
1
From the FrameTEC menu bar, select Comprehend Ideas, Frame – Control Chart.
2
In the top left corner above the table in the cell labeled “Click here and type topic,” type the subject that the team will be discussing.
3
Complete a run chart as directed in Procedure 27: Frame – Run Chart / Time Plot.
4
Statistically determine the Upper and Lower Control Limits on the chart.
5
Draw the Upper and Lower Control Limits on the chart.
6
Note the common causes that can be affected by changing / improving the process.
7
Analyze / resolve the special causes found outside control limits to get back in control.
Help:
· To add more rows beyond the original four that are provided in the table, press TAB, or if you need to create a blank row, put the cursor at the end of a row outside the table and press ENTER.
· If you would like to move to a new frame, be sure to click outside of the bottom of the table and press RETURN first; then insert the next tool frame that is desired from the drop down FrameTEC list.
Purpose
The goal!
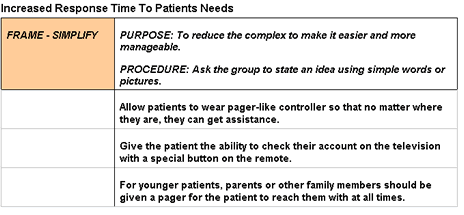
To reduce the complex to make it easier and more manageable.
What to do:
Ask the team to state an idea using simple words or pictures.
When to use:
If the team is having trouble understanding someone’s ideas, it is essential to get them to simplify them with straightforward statements or even pictures so that each member fully comprehends the idea or planned action.
Responsibility
Team Facilitator
Procedure
Step
Action
1
From the FrameTEC menu bar, select Comprehend Ideas, Frame – Simplify.
2
In the top left corner above the table in the cell labeled “Click here and type topic,” type the subject that the team will be discussing.
3
In the cells labeled “Click here and type idea,” document the teams’ ideas using simple words or pictures that will help reduce complexity.
Help:
· To add more rows beyond the original four that are provided in the table, press TAB, or if you need to create a blank row, put the cursor at the end of a row outside the table and press ENTER.
· If you would like to move to a new frame, be sure to click outside of the bottom of the table and press RETURN first; then insert the next tool frame that is desired from the drop down FrameTEC list.
Example
Tools
FrameTEC-MS Word
Purpose
The goal!
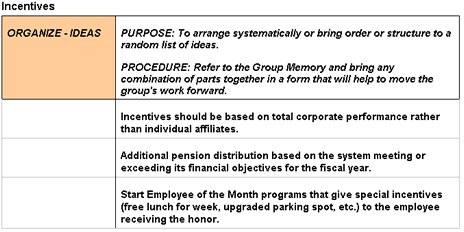
To arrange systematically or bring order or structure to a random list of ideas.
What to do:
Refer to the Team Memory and bring any combination of parts together in a form that will help to move the team’s work forward.
When to use:
If ideas were just spurted sporadically by team members, it is necessary to restructure them in an organized fashion that will enable the team to understand and correlate all related ideas.
Responsibility
Team Facilitator
Procedure
Step
Action
1
From the FrameTEC menu bar, select Comprehend Ideas, Organize – Ideas.
2
In the top left corner above the table in the cell labeled “Click here and type topic,” type the subject that the team will be discussing.
3
In the cells labeled “Click here and type idea,” copy and paste those statements that relate specifically to the topic being discussed in order to organize the teams’ ideas.
Important: If you need further instructions on how to copy and paste, go to the next procedure, Copying and Pasting Ideas.
Copying and Pasting Ideas
Step
Action
1
To copy, highlight an idea and press CTRL + C.
2
To paste, place the cursor into the correct cell and press CTRL + V.
Help:
· To add more rows beyond the original four that are provided in the table, press TAB, or if you need to create a blank row, put the cursor at the end of a row outside the table and press ENTER.
· If you would like to move to a new frame, be sure to click outside of the bottom of the table and press RETURN first; then insert the next tool frame that is desired from the drop down FrameTEC list.
Example
Tools
FrameTEC-MS Word
Purpose
The goal!
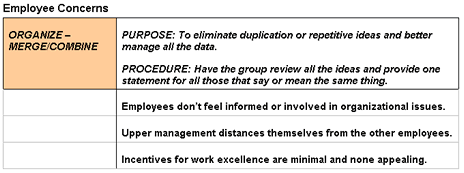
To eliminate duplication or repetitive ideas and better manage all the data.
What to do:
Have the team review all the ideas and provide one statement for all those that say or mean the same thing.
When to use:
If there are more than one statements that virtually imply or say the same thing, they should be combined in order to reduce repetition and streamline brainstorming ideas and lists.
Responsibility
Team Facilitator
Procedure
Step
Action
1
From the FrameTEC menu bar, select Comprehend Ideas, Organize – Merge/Combine.
2
In the top left corner above the table in the cell labeled “Click here and type topic,” type the subject that the team will be discussing.
3
Filter through the idea list, gathering those ideas that repeat information.
4
Have the team provide one statement for these repetitive ideas.
5
Type the new statements in the cell labeled “Click here and type idea.”
6
Repeat steps 3 – 5 for all statements that have duplicates in the list in order to better manage all the ideas.
Help:
· To add more rows beyond the original four that are provided in the table, press TAB, or if you need to create a blank row, put the cursor at the end of a row outside the table and press ENTER.
· If you would like to move to a new frame, be sure to click outside of the bottom of the table and press RETURN first; then insert the next tool frame that is desired from the drop down FrameTEC list.
Example
Tools
FrameTEC-MS Word
Purpose
The goal!
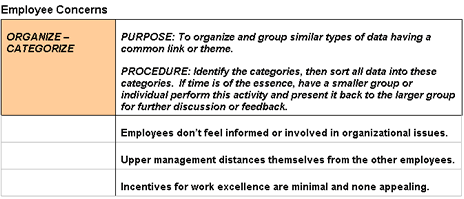
To organize and group similar types of data that have a common link or theme.
What to do:
Identify the categories, then sort all data into these categories. If time is of the essence, have a smaller portion of the team or individual perform this activity and present it back to the entire team for further discussion or feedback.
When to use:
If the team has gathered data and some of them are similar, identifying categories and then sorting them accordingly will help visually display a common link to the team.
Responsibility
Team Facilitator
Procedure
Step
Action
1
From the FrameTEC menu bar, select Comprehend Ideas, Organize – Categorize.
2
In the top left corner above the table in the cell labeled “Click here and type topic,” type the subject that the team will be discussing.
3
Filter through the idea list, gathering those ideas that all can be categorized into one theme.
4
Type these ideas in the cells labeled “Click here and type idea.”
5
Repeat categorizing steps 3 – 4 until all ideas have been linked to their proper category.
Help:
· To add more rows beyond the original four that are provided in the table, press TAB, or if you need to create a blank row, put the cursor at the end of a row outside the table and press ENTER.
· If you would like to move to a new frame, be sure to click outside of the bottom of the table and press RETURN first; then insert the next tool frame that is desired from the drop down FrameTEC list.
Example
Tools
FrameTEC-MS Word
Purpose
The goal!
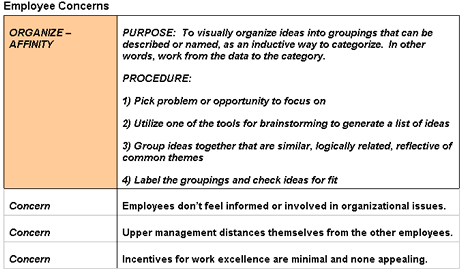
To visually organize ideas into groupings that can be described or named as an inductive way to categorize. In other words, work from the data to the category.
What to do:
Pick a problem or opportunity to focus on. Generate a list of ideas and then group the ideas together that are similar, logically related, and / or reflective of common themes. Label the groupings for organizational purposes and check for official fit.
When to use:
If the team has gathered a large sum of disordered data, using the affinity technique assists in identifying categories and then sorting them accordingly, visually displaying a common link to the team.
Responsibility
Team Facilitator
Procedure
Step
Action
1
From the FrameTEC menu bar, select Comprehend Ideas, Organize – Affinity.
2
In the top left corner above the table in the cell labeled “Click here and type topic,” type the subject that the team will be discussing.
3
In the left hand cell labeled “Click here and type label,” type the label / theme.
4
Filter through the idea list, gathering those ideas that can be categorized into the chosen label.
5
In the right hand cells labeled “Click here and type idea,” Type the ideas that relate to the category.
6
Repeat steps 3 – 5 until all ideas have been linked by category.
Help:
· To add more rows beyond the original four that are provided in the table, press TAB, or if you need to create a blank row, put the cursor at the end of a row outside the table and press ENTER.
· If you would like to move to a new frame, be sure to click outside of the bottom of the table and press RETURN first; then insert the next tool frame that is desired from the drop down FrameTEC list.
Example
Tools
FrameTEC-MS Word
Purpose
The goal!
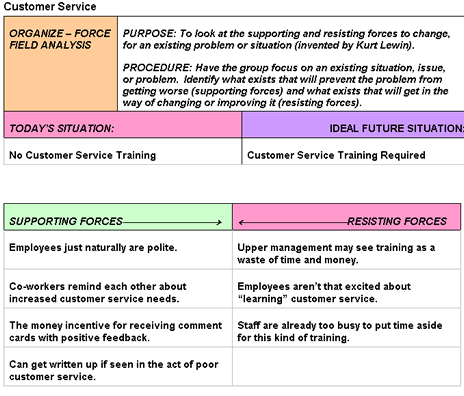
To look at the supporting and resisting forces to change, for an existing problem or situation (invented by Kurt Lewin).
What to do:
Have the team focus on an existing situation, issue, or problem. Identify what exists that will prevent the problem from getting worse (supporting forces) and what exists that will get in the way of changing or improving it (resisting forces).
When to use:
If a process needs to be investigated in order to determine if change or improvement is necessary, force field analysis helps make a decision based on logical insights.
Responsibility
Team Facilitator
Procedure
Step
Action
1
From the FrameTEC menu bar, select FrameTEC, Comprehend Ideas, and Organize – ForceField Analysis.
Result: The Force Field Analysis frame appears.
2
In the top left corner above the table in the cell labeled “Click here and type topic”, type the subject that the team will be discussing.
3
In the cell labeled “Click here and type today’s situation”, type the current problem, issue, or situation that the team will be discussing.
4
In the adjacent cell labeled “Click here and type ideal future situation”, type what the team considers to be the perfect, improved situation or issue.
5
In the right cell labeled “Click here and type supporting force”, type the team’s shared ideas/issues that will prevent the problem from getting worse.
6
In the left cell labeled “Click here and type resisting force”, type the team’s shared ideas/issues that will get in the way of changing or improving the problem.
Note:
· If you would like to add more rows beyond the original four that are provided for you in the table, press TAB.
· If you would like to add a new frame, click outside of the bottom of the table and press ENTER; then select the appropriate tool frame that is desired from the drop down FrameTEC list.
Example
Tools
FrameTEC-MS Word
Purpose
The goal!
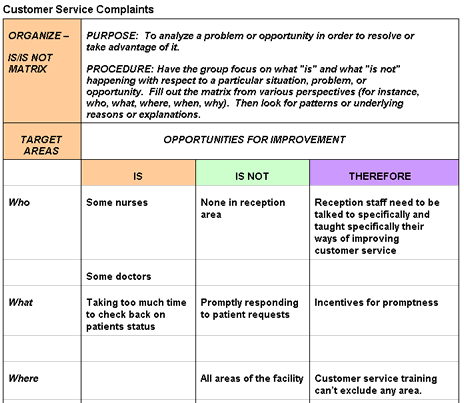
To analyze a problem or opportunity in order to resolve or take advantage of it.
What to do:
Have the team focus on what “is” and what “is not” happening with respect to a particular situation, problem, or opportunity. Fill out the matrix from various perspectives (for instance, who, what, where, when, why). Then look for patterns or underlying reasons or explanations.
When to use:
If there are a number of influences that need to be considered for making a decision.
Responsibility
Team Facilitator
Procedure
Step
Action
1
From the FrameTEC menu bar, select Comprehend Ideas, Organize – Is / Is Not Matrix.
2
In the top left corner above the table in the cell labeled “Click here and type topic,” type the problem or opportunity that the team will be discussing.
3
Going down the matrix on the right, have the team discuss what “is” and “is not” happening in respect to each of the provided perspectives.
Example: Who, what, where, etc…
4
Document the statements under the corresponding columns.
5
Use the “Therefore” column to document patterns or underlying reasons, explanations, or suggestions for improvement.
Help:
· To add more rows beyond the original four that are provided in the table, press TAB, or if you need to create a blank row, put the cursor at the end of a row outside the table and press ENTER.
· If you would like to move to a new frame, be sure to click outside of the bottom of the table and press RETURN first; then insert the next tool frame that is desired from the drop down FrameTEC list.
Example
Tools
FrameTEC-MS Word
Purpose
The goal!
To split or “stratify” data to expose underlying patterns in order to localize a problem or make it easier to identify the cause of a problem.
What to do:
List characteristics, factors, or potential causes for systematic differences in results.
Complete a data collection form. Look for patterns related to time, sequence, or impact. State possible reasons or explanations for these patterns.
When to use:
Use in analyzing data to find improvement opportunities. Stratification breaks down single numbers into meaningful categories or classifications to focus corrective action.
Responsibility
Team Facilitator
Procedure
Important: If you did not prepare a FrameTEC file in the Overview task please do so now.
Step
Action
1
From the FrameTEC menu bar, select Comprehend Ideas, Organize – Stratification.
2
In the top left corner above the table in the cell labeled “Click here and type topic,” type the problem or opportunity that the team will be discussing.
3
Help:
· To add more rows beyond the original four that are provided in the table, press TAB, or if you need to create a blank row, put the cursor at the end of a row outside the table and press ENTER.
· If you would like to move to a new frame, be sure to click outside of the bottom of the table and press RETURN first; then insert the next tool frame that is desired from the drop down FrameTEC list.
Tools
FrameTEC-MS Word